Generative Reflection Combinatorial Triangle (GRCT) kernel
In this notebook we provide examples of how the generative reflection combinatorial triangle (GRCT) kernel, introduced in v1.4 is used
[1]:
from hypertiling import HyperbolicTiling, HyperbolicGraph, TilingKernels, GraphKernels
from hypertiling.graphics.plot import plot_tiling

import matplotlib.cm as cmap
import numpy as np
import time
Initialization
The GRCT kernel can be accessed by the HyperbolicTiling and HyperbolicGraph factory pattern. In both cases, the same GRC class object is initalized. The difference between both calls are the default values given to the GRCT class for initialization:
In general, GRCT takes three different keyword arguments with the corresponding defaults
tiling = False: Controlls whether cell coordinates are calculated (True)
nbrs = False: Controlls whether the neighborhood relations are calculated (True)
size = None: Maximal number of nodes for preallocation. If None, an estimate is used. This function usually overestimates the number quite a lot!
On one hand, advantage of having coordinates is that we can plot the tilings. On the other hand, tilings require more time and memory to be generated.
If GRCT is called by the HyperbolicTiling factory pattern, the tiling keyword is adjusted such that tiling=True. Similarily, if GRCT is called by the HyperbolicGraph factory pattern, the graph keyword is adjusted such that graph=True.
Please note that in both cases, the other keyword can be manually set to either value. In case of tiling and nbrs being True, the results of HyperbolicTiling and HyperbolicGraph are identical.
[2]:
p, q, r, n = 5, 4, 3, 17
# Create some tilings
t0 = time.time()
t = HyperbolicTiling(p, q, r, n, kernel=TilingKernels.GRCT) # tiling = True, nbrs = False
t1 = time.time()
print(f"Tiling took {t1 - t0}")
print("=======================================")


# Create some graphs
t0 = time.time()
t = HyperbolicGraph(p, q, r, n, kernel=GraphKernels.GRCT) # tiling = False, nbrs = False
t1 = time.time()
print(f"Graph took {t1 - t0}")
print("=======================================")

# if tiling and nbrs are True, HyperbolicTiling and HyperbolicGraph return identical results
# HyperbolicTiling pattern
t0 = time.time()
t = HyperbolicTiling(p, q, r, n, kernel=TilingKernels.GRCT, nbrs=True) # tiling = True, nbrs = True
t1 = time.time()

# HyperbolicGraph pattern
t3 = time.time()
t = HyperbolicGraph(p, q, r, n, kernel=GraphKernels.GRCT, tiling=True) # tiling = True, nbrs = True
t4 = time.time()


print("Identical (tiling=True, nbrs=True):")
print(f"\tHyperbolicTiling: {t1 - t0}")
print(f"\tHyperbolicGraph: {t4 - t3}")
Tiling took 0.06067490577697754
=======================================
Graph took 0.01953125
=======================================
Identical (tiling=True, nbrs=True):
        HyperbolicTiling: 0.07746672630310059
        HyperbolicGraph: 0.06593990325927734
Examples
Simple Schwarizan triangle tiling
[3]:
t = HyperbolicTiling(3, 9, 3, 15, kernel=TilingKernels.GRCT)
[4]:
ct = np.zeros(len(t))
for i, poly in enumerate(t):
    val = np.real(poly[0])-np.imag(poly[0])
    ct[i] = np.sign(val)*(np.abs(val))**1.4
[5]:
plot_tiling(t, ct, cmap=cmap.RdYlGn, edgecolor="w", lw=1, clim=[-1,1]);

Tiling as Vector Graphics
[6]:
from hypertiling import HyperbolicTiling
import hypertiling.graphics.svg as svg
[7]:
# generate tiling
tiling = HyperbolicTiling(5, 4, 6, 10, kernel="GRCT")

# we color the tiling by layer
colors = [0.0, 0.2, 0.4, 0.6, 0.8, 1.0]

# query layer information
tiling_colors = [colors[tiling.get_reflection_level(i) % len(colors)] for i in range(len(tiling))]

# create and draw svg image
tiling_svg = svg.make_svg(tiling, tiling_colors, unitcircle=True, cmap="YlOrBr")
svg.draw_svg(tiling_svg)

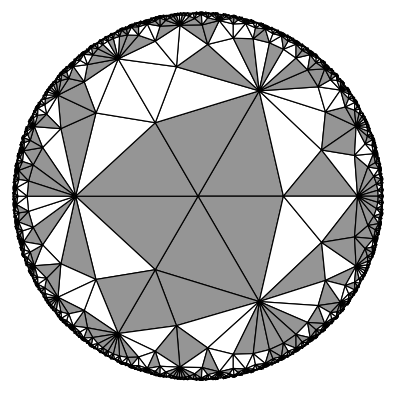
Voter model
In this simple statistic model, cells will always take on the color of the majority of their adjacent cells
[8]:
from hypertiling.graphics.plot import plot_tiling

import random
import matplotlib.pyplot as plt
import matplotlib.cm as cmap
Tiling vs Graph
For applications like finding the lowest energy state by quenching its not necessary to have coordinates. In this case, a graph can be used as its construction is faster for large tilings.
However, quenching times are often magnitudes larger than the generation time even in full tiling mode. Nonetheless the advantage of reduced memory requirements holds and can be curical especially for large tilings. In fact, the memory requirement for the coordinates often is a magnitude larger than for the neighbor relations and construction.
Prepare function which computes the energy of a configuration
[9]:
def get_energy(t):
    sum_ = 0
    for index in range(len(t)):
        sum_ += sum([0 if states[nbr] == states[index] else 1 for nbr in t.get_nbrs(index)])
    return sum_
Set tiling/graph parameters
[10]:
p, q, r, n = 7, 3, 3, 22
Tiling
[11]:
t1 = time.time()
t = HyperbolicTiling(p, q, r, n, kernel="GRCT", nbrs=True)
print(f"Generation of {len(t)} polygons took {round(time.time() - t1,5)} s")
Generation of 202464 polygons took 0.67832 s
Extract the neighbours
[12]:
t1 = time.time()
nbrs = t.get_nbrs_list()
print(f"Get nbrs took {round(time.time() - t1,5)} s")
Get nbrs took 0.88835 s
Initialize the voter model with random state space
[13]:
states = np.random.randint(0, 2, size=len(t))
plot_tiling(t, states, cmap=cmap.Greys, edgecolor="k", cutoff=0.01, lw=0.7, clim=[0,2]);
print(f"Energy of the state is {get_energy(t):.2e}")
Energy of the state is 2.35e+05
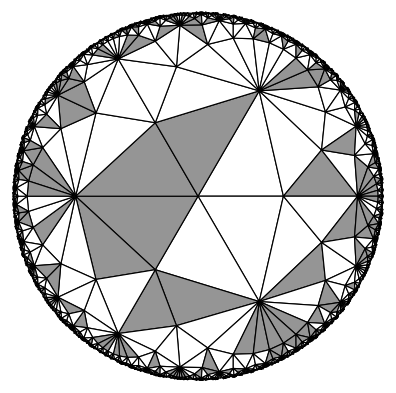
Run the model and display resulting configuration
[14]:
its = 1e5 # number of iterations

for i in range(int(its)):
    index = int(len(t) * np.random.random())
    sum_ = sum([states[nbr] for nbr in t.get_nbrs(index)])
    if sum_ >= p // 2:
        states[index] = 1
    else:
        states[index] = 0

plot_tiling(t, states, cmap=cmap.Greys, edgecolor="k", cutoff=0.01, lw=0.7, clim=[0,2]);
print(f"Energy of the state is {get_energy(t):.2e}")
Energy of the state is 1.88e+05
Graph
When using the graph we are not able to plot the graph as we lack coordinates. This reduced memory would allow for larger tilings. However, as this is a demo notebook, we wont do that here for time reasons.
[15]:
t1 = time.time()
t = HyperbolicGraph(p, q, r, n, kernel="GRCT")
print(f"Generation of {len(t)} polygons took {round(time.time() - t1,5)} s")
Generation of 202464 polygons took 0.37295 s
[16]:
t1 = time.time()
nbrs = t.get_nbrs_list()
print(f"Get nbrs took {round(time.time() - t1,5)} s")
Get nbrs took 0.87424 s
[17]:
states = np.random.randint(0, 2, size=len(t))
print(f"Energy of the state is {get_energy(t):.2e}")
its = 1e5 # number of iterations

for i in range(int(its)):
    index = int(len(t) * np.random.random())
    sum_ = sum([states[nbr] for nbr in t.get_nbrs(index)])
    if sum_ >= p // 2:
        states[index] = 1
    else:
        states[index] = 0

print(f"Energy of the state is {get_energy(t):.2e}")
Energy of the state is 2.35e+05
Energy of the state is 1.88e+05
Further methods
get_reflection_level
The natural defintion of layers of the GR kernel family is different compared to SR and Dunham kernels. To access the natural layer definition of these kernels, we provide the get_reflection_levelmethod:
[18]:
from hypertiling import HyperbolicTiling, TilingKernels
import hypertiling.graphics.svg as svg

# some colors for the different layers
colors = [0.0, 0.2, 0.4, 0.6, 0.8, 1.0]

t = HyperbolicTiling(3, 9, 3, 11, kernel=TilingKernels.GRCT)

# plot reflective layers
tiling_colors = [colors[t.get_reflection_level(i) % len(colors)] for i in range(len(t))]
tiling_svg = svg.make_svg(t, tiling_colors, unitcircle=True, cmap="YlOrBr")
svg.draw_svg(tiling_svg)

check_integrity
For GRCT, a check_integrity method is available if nbrs=True. As, even for tilings, the coordinates and cells are generated by a combinatoric algorithm, this method verifies whether the graph structure created by the same process is consistent. This is done in a two step process:
First, the number of nbrs for each cell except the last layer is controlled to match p
Second, a bidirectional search is applied around each pair of nbrs, excluding the direct connection. This naturally should result in the paths around the two common vertices. If no path is found in the expected number of steps, the graph is considered corrupted. However, this method is only available up to the (n - (q - 1) // 2)th layer.
[19]:
import hypertiling.ion as ion

ion.set_verbosity_level("Status")
p, q, r, n = 7, 3, 3, 17

graph = HyperbolicGraph(p, q, r, n, kernel="GRCT")
graph.check_integrity()
[hypertiling] The verbosity level is set to:
     1 Warning
 >>> 2 Status
     3 Debug
     4 Develop
[hypertiling] Status: Schwarzian triangle with (p, q, r) with n layers selected
[hypertiling] Status: Integrity can only be ensured for the first n - max(p, q, r) 1 layer and thus layer 11
|>>>>>>>>>>>>>>>>>>>>>>>>>>>>>>>>>>>>>>>>>>>>>>>>>>>>>>>>>>>>>>>>| Controlling nbrs for 8141 / 8141[hypertiling] Status: [hypertiling] Status: [hypertiling] Status: [hypertiling] Status:
|>>>>>>>>>>>>>>>>>>>>>>>>>>>>>>>>>>>>>>>>>>>>>>>>>>>>>>>>>>>>>>>>| Bidirectional search for cell 1289 / 1289[hypertiling] Status: ypertiling] Status: [hypertiling] Status: [hypertiling] Status: [hypertiling] Status:
[hypertiling] Status: Integrity ensured!
[19]: