Geodesics
In this notebook we demonstrate how geodesic lines in the Poincare disk can be constructed
See also the notebook “advanced-visualization”, where the vector graphics capabilities of hypertiling are demonstrated.
[1]:
import numpy as np
import matplotlib.cm as cmap
import matplotlib.pyplot as plt
[2]:
from hypertiling import HyperbolicTiling
from hypertiling.graphics.plot import plot_tiling
from hypertiling.geodesics import geodesic_arc, geodesic_midpoint
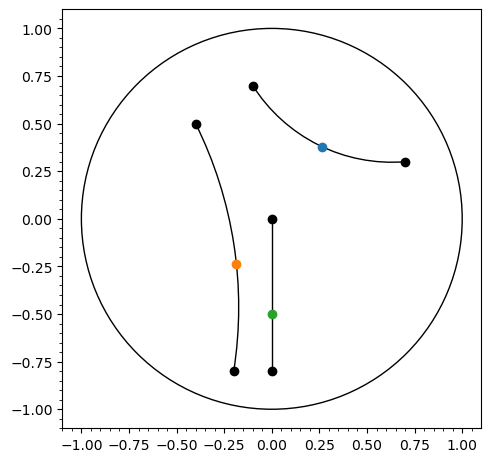
Construct arc circles and midpoints
[3]:
# sample points
z1 = complex(-0.1,0.7)
z2 = complex(0.7,0.3)

z3 = complex(-0.2,-0.8)
z4 = complex(-0.4,0.5)

z5 = complex(-0.0,-0.8)
z6 = complex(-0.0,0.0)
[4]:
fig, ax = plt.subplots(figsize=(5,5), dpi=100)

# construct midpoint between z1 and z2
plt.scatter(z1.real, z1.imag, c="k")
plt.scatter(z2.real, z2.imag, c="k")
zm = geodesic_midpoint(z1,z2)
plt.scatter(zm.real, zm.imag, zorder=4)
# plot circle arc
arc = geodesic_arc(z1,z2,lw=1)
arc.set_color('k')
ax.add_artist(arc)

# construct midpoint between z3 and z4
plt.scatter(z3.real, z3.imag, c="k")
plt.scatter(z4.real, z4.imag, c="k")
zm = geodesic_midpoint(z3,z4)
plt.scatter(zm.real, zm.imag, zorder=4)
# plot circle arc
arc = geodesic_arc(z3,z4,lw=1)
arc.set_color('k')
ax.add_artist(arc)

# construct midpoint between z5 and z6
plt.scatter(z5.real, z5.imag, c="k")
plt.scatter(z6.real, z6.imag, c="k")
zm = geodesic_midpoint(z5,z6)
plt.scatter(zm.real, zm.imag, zorder=4)
# plot circle arc
arc = geodesic_arc(z5,z6,lw=1)
arc.set_color('k')
ax.add_artist(arc)

# plot unit circle
ax.add_patch(plt.Circle((0.0, 0.0), radius=1, edgecolor='k', facecolor='None'))
plt.xlim(-1.1,1.1); plt.ylim(-1.1,1.1)
plt.gca().set_aspect('equal')
plt.minorticks_on()
plt.tight_layout(); plt.show()
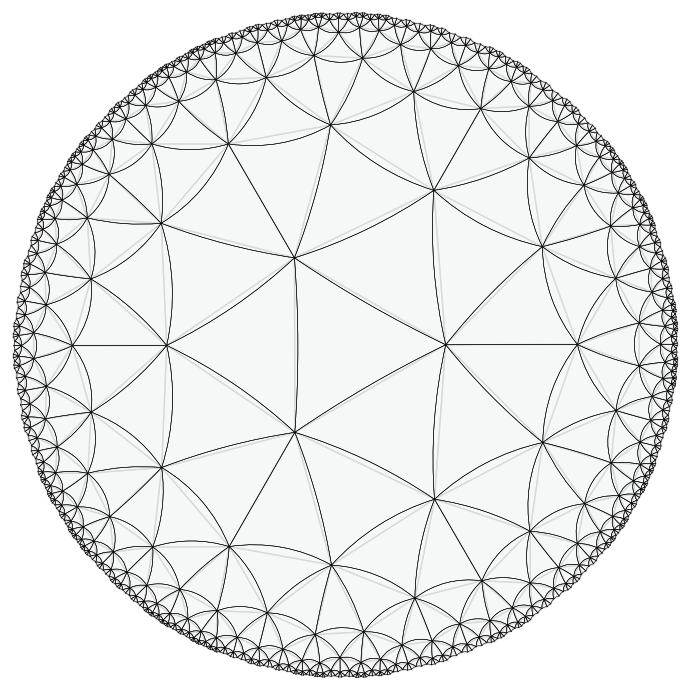
Use geodesic line segments in tiling plots
[5]:
from hypertiling.graphics.plot import convert_polygons_to_patches, convert_edges_to_arcs
[6]:
# construct tiling
T = HyperbolicTiling(3,7,6)

# create figure
fig, ax = plt.subplots(figsize=(8,7), dpi=100)

# plot cells with simple (non-geodesic) edges
pgons = convert_polygons_to_patches(T, np.zeros(len(T)), cmap=cmap.RdBu, edgecolor="0.85", clim=[-1,1])
ax.add_collection(pgons)

# convert cell edges to matplotlib arcs
edges, types = convert_edges_to_arcs(T, lw=0.4)
for edge in edges:
    ax.add_artist(edge)
    edge.set_color('k')

plt.xlim(-1,1); plt.ylim(-1,1)
plt.axis("off"); plt.gca().set_aspect('equal')
plt.tight_layout(); plt.show()
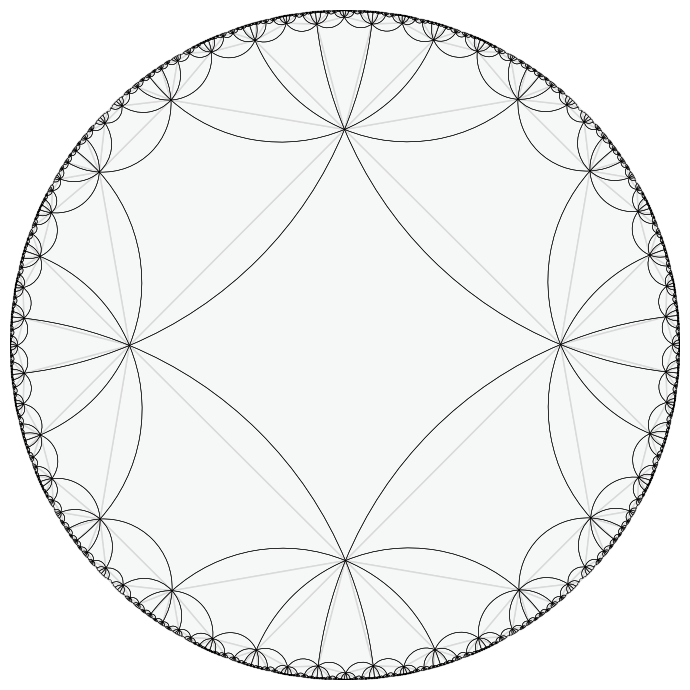
[7]:
# construct tiling
T = HyperbolicTiling(4,8,4)

# create figure
fig, ax = plt.subplots(figsize=(8,7), dpi=100)

# plot cells with simple (non-geodesic) edges
pgons = convert_polygons_to_patches(T, np.zeros(len(T)), cmap=cmap.RdBu, edgecolor="0.85", clim=[-1,1])
ax.add_collection(pgons)

# convert cell edges to matplotlib arcs
edges, types = convert_edges_to_arcs(T, lw=0.4)
for edge in edges:
    ax.add_artist(edge)
    edge.set_color('k')

plt.xlim(-1,1); plt.ylim(-1,1)
plt.axis("off"); plt.gca().set_aspect('equal')
plt.tight_layout(); plt.show()
[ ]: