Quickstart
This Jupyter notebook demonstrates how a hyperbolic tiling can be constructed and plotted using only very few lines of code.
Import tiling object from hypertiling library
[1]:
from hypertiling import HyperbolicTiling
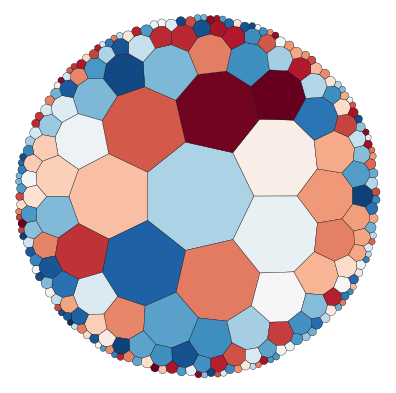
Set parameters and generate the tiling
[2]:
p = 7
q = 3
nlayers = 5

T = HyperbolicTiling(p,q,nlayers)
The size of the tiling can be queried like this
[3]:
print("Number of cells:", len(T))
Number of cells: 232
Import and use available script for a quick plot
[4]:
from hypertiling.graphics.plot import plot_tiling

import matplotlib.cm as cmap
import numpy as np
[5]:
colors = np.random.rand(len(T))

plot_tiling(T, colors, cmap=cmap.RdBu, edgecolor="k", linewidth=0.2);
By default, tilings are centered around a “cell”. They can also be centered around a vertex at the origin, using the following syntax
[6]:
p = 4
q = 5
nlayers = 4

T = HyperbolicTiling(p, q, nlayers, center="vertex")
This example also demonstrates how keyword arguments like “clim” can easily be passed through the plot function
[7]:
plot_tiling(T, np.random.rand(len(T)), cmap=cmap.OrRd, edgecolor="w", lw=1, clim=[-1,2]);

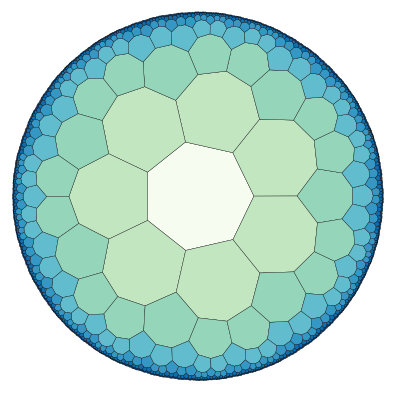
In the next example we demonstrate how one can easily iterate over the cells of a tiling, e.g. in order to access their attributes
[8]:
T = HyperbolicTiling(7, 3, 7, center="cell")
Paint cells by number of layer in which they reside
[9]:
colors = []
for i in range(len(T)):
    colors.append(T.get_layer(i))

plot_tiling(T, colors, cmap=cmap.GnBu, edgecolor="k", lw=0.2);
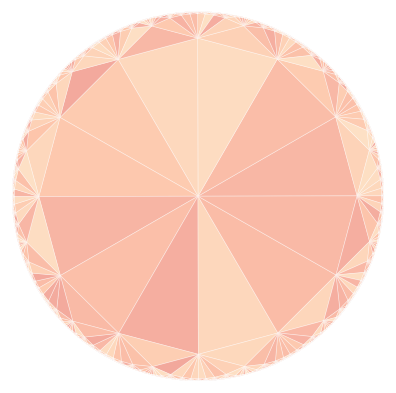
Finally, something which just looks nice :)
[10]:
T = HyperbolicTiling(3, 12, 4, center="vertex")
[11]:
plot_tiling(T, np.random.rand(len(T)), cmap=cmap.OrRd, edgecolor="w", lw=0.4, clim=[-1,2]);

The colors are a bit bright. Let’s make them more transparent.
[12]:
plot_tiling(T, np.random.rand(len(T)), cmap=cmap.OrRd, edgecolor="w", lw=0.4, clim=[-1,2], alpha=0.5);