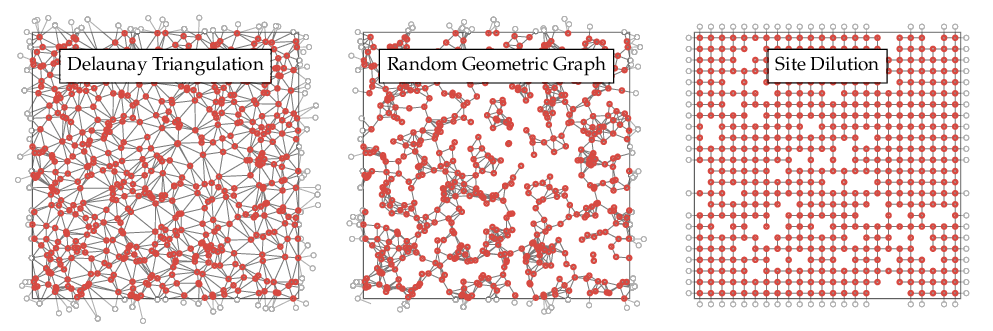
Figure 1. Disordered lattices. The right panel represents a regular square lattice, where a number of sites have randomly been removed. The middle and left panel illustrate realizations of topological disorder, where the positions of the points are randomly chosen.
Besides disordered structures originating from regular ones by, for instance, random dilutions or deformations, one might go one step further and place the nodes randomly in space. Connecting the cloud of points according to given geometric rules then gives rise to what is called topological disorder. If, moreover, interactions are solely local, i.e. only short-ranged links between nodes exist, one speaks of proximity graphs. One such construction is the random geometric graph, where each node is connected to all nodes within a given fixed distance, as can be seen in Figure 1. However, the possibilities are essentially endless here. Linking rules might, for instance, attempt to model certain real materials, or mimic their growth processes or, still, simply display a theoretically interesting property. From a more abstract, theoretical point of view, the exact realization of the disorder might however only play a secondary role. One is more interested in identifying the overarching characteristics which influence the physical model, instead of focusing on individual specifics. In the context of critical phenomena, the central question can be stated as follows:
Under the influence of quenched disorder, will the universal properties of a continuous phase transition be altered or do they remain unaffected by this perturbation?
Here we demonstrate MARQOV's ability to handle disordered lattice by presenting simulations of the Ising model on a 2D Voronoi graph. In this article 1 we verified that the model still belongs to the clean Ising universality. Furthermore, we were able to report the leading correction-to-scaling exponent to considerable precision.
The curves in Figure 2 are computed via reweighting techniques from a single run at the inverse temperature indicated by the vertical dotted line. The black dots mark the maxima of the scaling function in the left panel and crossing points of \((L,2L)\) lattice pairs of the correlation length in units of the lattice size in the right panel and can be used for extracting critical exponents. For the smaller lattices up to \( 10^5 \) disorder realizations were simulated, whereas at least 5000 replicas were used for the largest lattices.
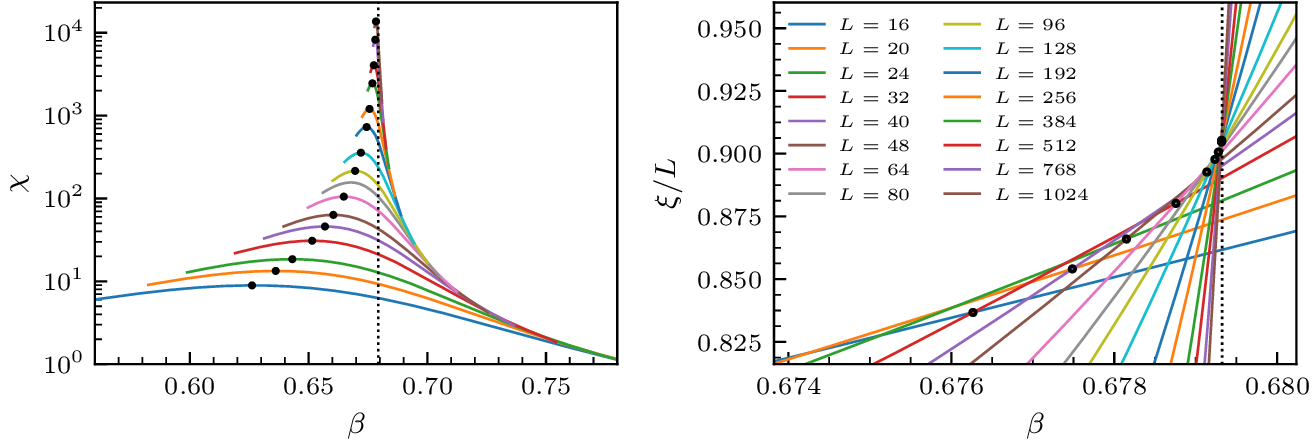
Figure 2. Susceptibility (left) and correlation length (right) of the Ising model on a Voronoi lattice.
- Schrauth, M., & Portela, J. S. (2019). Universality of continuous phase transitions on random Voronoi graphs. Physical Review E, 100(6), 062118. ↩