Dispersion of a HgTe quantum well
Simple dispersion for a 7 nm HgTe layer sandwiched between (Hg,Cd)Te barriers on a (Cd,Zn)Te substrate.
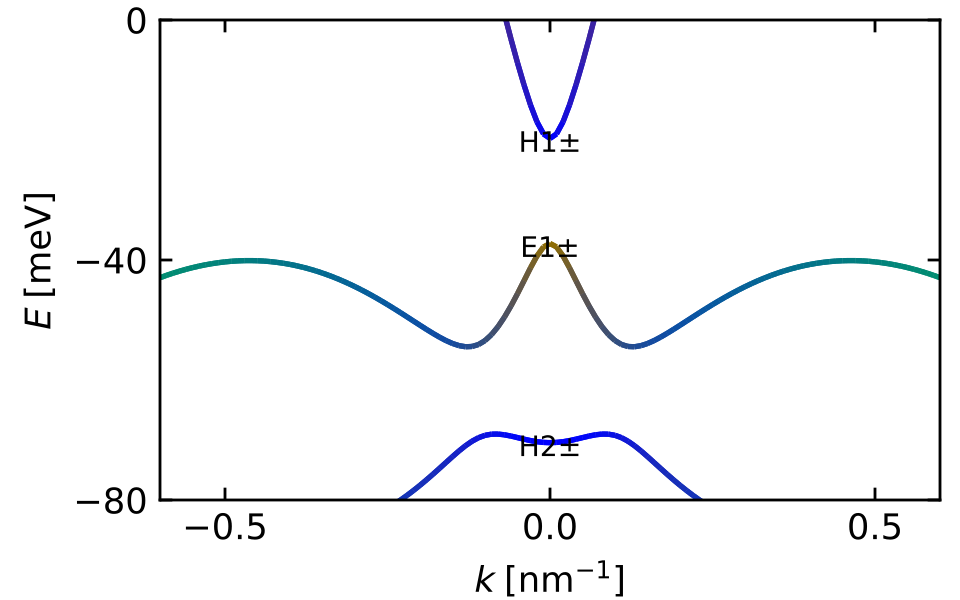
kdotpy 2d 8o noax msubst CdZnTe 4% mlayer HgCdTe 68% HgTe HgCdTe 68% llayer 10 7 10 zres 0.25 k -0.6 0.6 / 120 kphi 45 erange -80 0 split 0.01 obs orbitalrgb char out -7nm outdir data extrema config 'fig_ticks_major=fewer;fig_extend_xaxis=0;plot_dispersion_parameter_text=false'
Landau fan of a HgTe quantum well
The Landau fan for the same 7 nm HgTe quantum well.
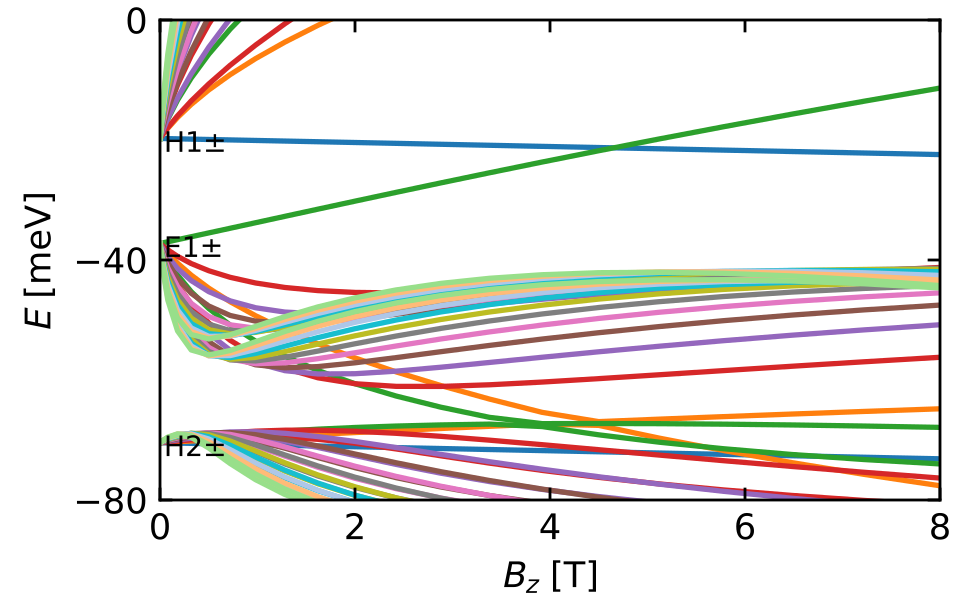
kdotpy ll 8o ax msubst CdZnTe 4% mlayer HgCdTe 68% HgTe HgCdTe 68% llayer 10 7 10 zres 0.25 b 0 8 // 20 nll 10 neig 120 erange -80 0 targetenergy 10 split 0.01 obs llindex char out -7nm outdir data hall config 'fig_ticks_major=normal,fewer;fig_extend_xaxis=0;plot_dispersion_parameter_text=false'
The Hall conductance as function of magnetic field and density. The density dependence is useful to compare to experimental result from magnetotransport.
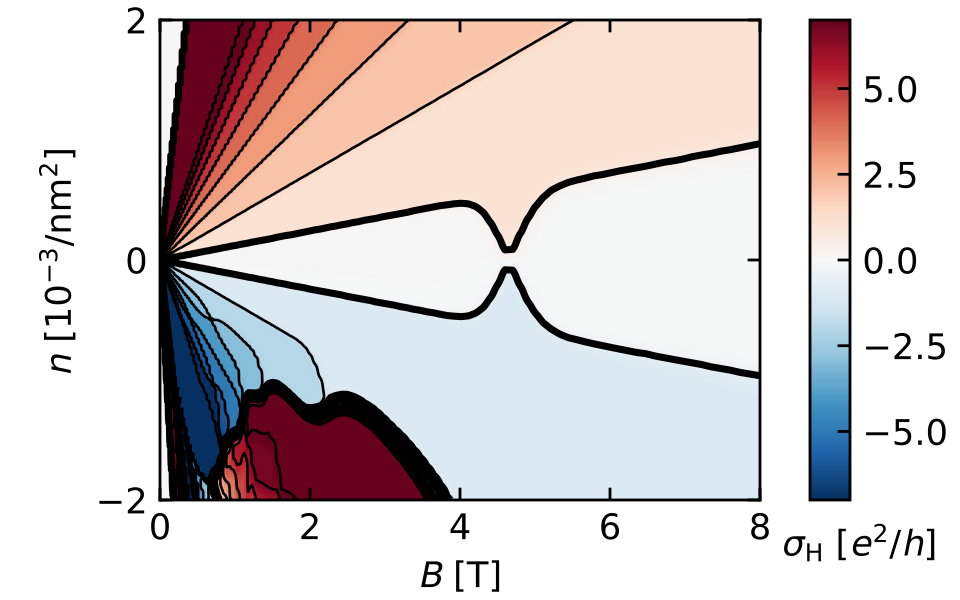
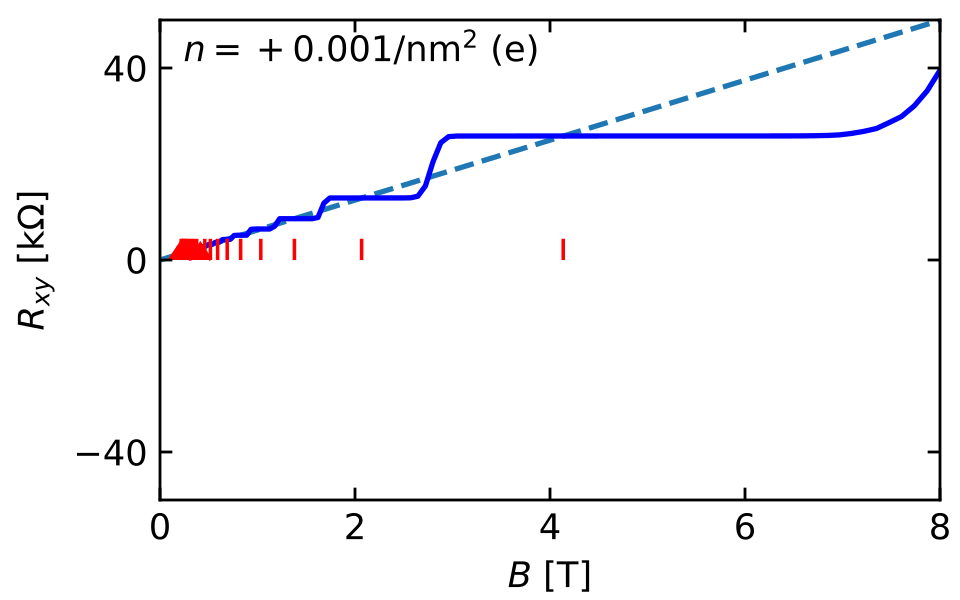
kdotpy ll 8o ax msubst CdZnTe 4% mlayer HgCdTe 68% HgTe HgCdTe 68% llayer 10 7 10 zres 0.25 b 0 8 // 40 nll 10 neig 200 erange -80 40 targetenergy 10 split 0.01 obs llindex char legend out -7nm outdir data hall config 'fig_ticks_major=normal,fewer;fig_extend_xaxis=0;plot_dispersion_parameter_text=false'
Optical transitions of a HgTe quantum well
Optical transitions for a 7 nm HgTe quantum well at a carrier density of n = 1 × 1011 cm-2. The plot visualizes the absorption A for each optical transition.
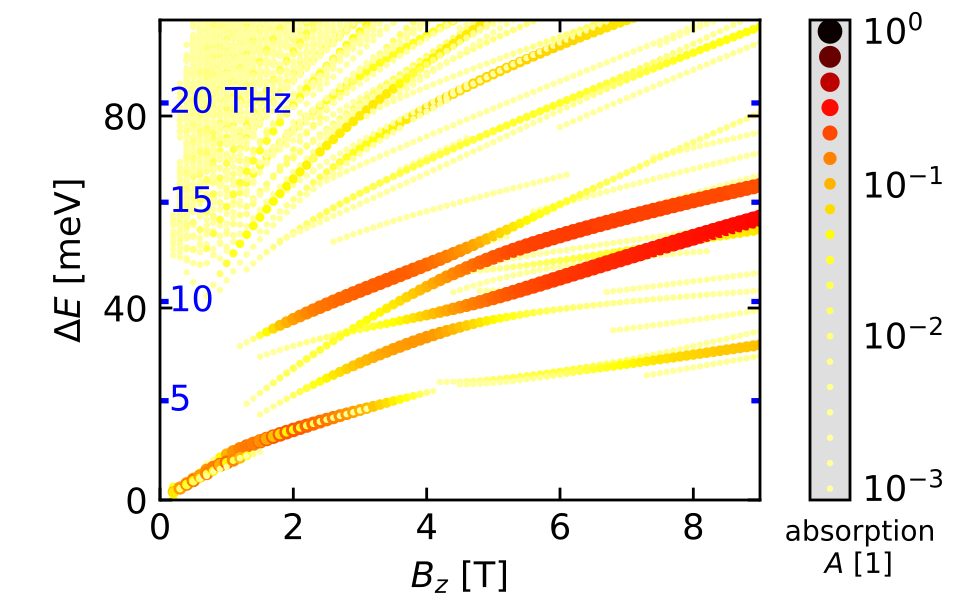
kdotpy ll 8o noax bia llfull msubst CdZnTe 4% mlayer HgCdTe 68% HgTe HgCdTe 68% llayer 10 7 10 zres 0.25 erange -100 100 split 0.01 nll 10 neig 200 targetenergy -20 b 0 9 / 90 cardens 0.001 broadening 2 gauss sqrt transitions llobs dos legend obs jz temp 4.2 config 'transitions_min_amplitude=1e9;transitions_max_deltae=100;plot_transitions_quantity=absorption;fig_ticks_major=normal,fewer;fig_extend_xaxis=0;plot_dispersion_parameter_text=false'
Dispersion of a 3D topological insulator
Using 70 nm of HgTe on a CdTe substrate. We indicate the surface character as red (top surface) and blue (bottom surface).
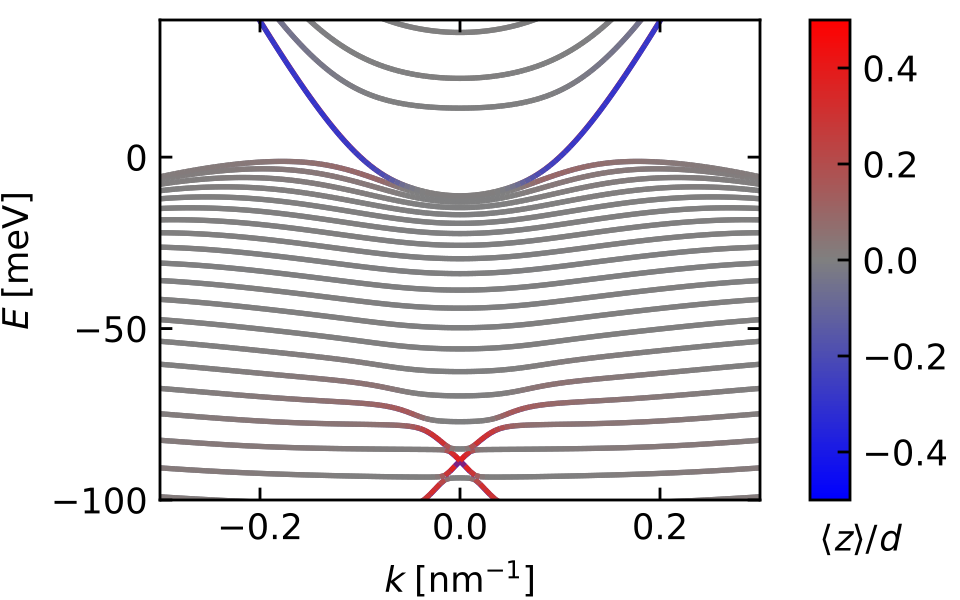
kdotpy 2d 8o noax msubst CdTe mlayer HgCdTe 68% HgTe HgCdTe 68% llayer 10 70 10 zres 0.25 k -0.3 0.3 / 120 kphi 0 split 0.01 erange -100 40 neig 100 obs z legend char out -3dti outdir data vinner 0.1 config 'fig_ticks_major=normal,fewer;fig_extend_xaxis=0;plot_dispersion_parameter_text=false'
The following is the dispersion of the highest valence band state, labelled H2+.
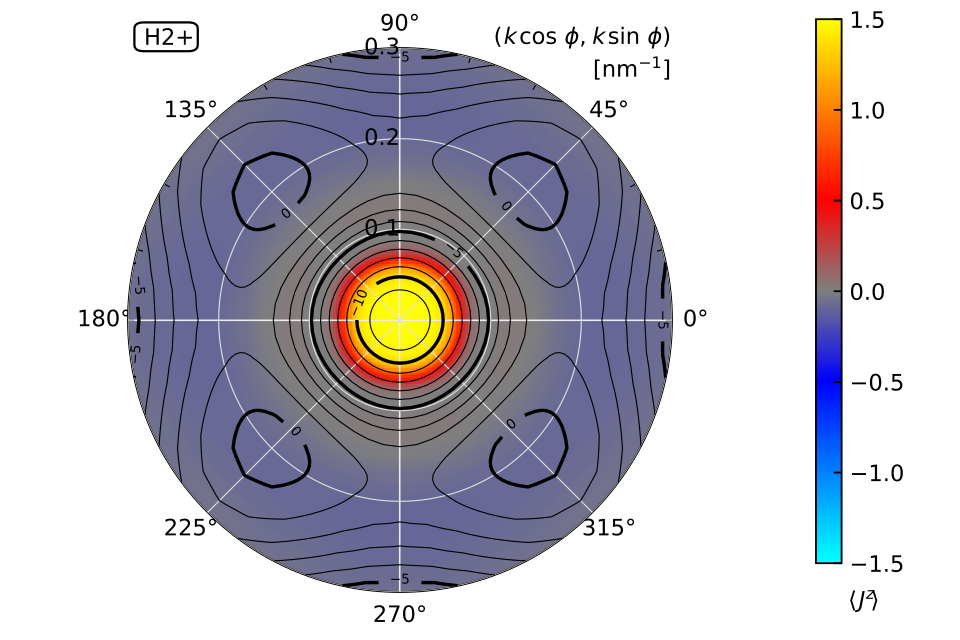
kdotpy 2d 8o noax msubst CdTe mlayer HgCdTe 68% HgTe HgCdTe 68% llayer 10 70 10 zres 0.25 k 0 0.3 / 60 kphi 0 90 / 12 symmetrize split 0.01 erange -100 40 neig 30 targetenergy 20 obs jz legend out -3dti-polar outdir data vinner 0.1